Coding Agent Index v2.0: What Claude Opus 5.5's 61.7 Does and Does Not Tell Developers
Artificial Analysis swapped a benchmark, reworded a rubric and ranked model-plus-harness pairs. Here is what the new leaderboard and its $11.42-a-task price tag actually measure.
In this story 10 sections
Artificial Analysis launched Coding Agent Index v2.0 on October 23, 2026. It averages three benchmarks across 290 tasks, and Claude Code running Claude Opus 5.5 leads at 61.7. The score ranks a model and its agent harness together, so it measures a working setup, not a bare model.
This explainer is for developers, engineering leads and AI buyers who see a new leaderboard number and need to decide whether it should change a tool choice. It covers what the index measures, what changed from the last version, what the cost column reveals, and where the number stops being useful. Emergent Wire tests AI capability claims against the evidence, and a benchmark reset is exactly when claims need the most scrutiny.
What Does the Coding Agent Index v2.0 Measure?

It measures how well a coding agent finishes real software tasks. The index is a simple, equal-weight average of three benchmarks, and each task is attempted three times, according to Artificial Analysis's methodology page.
- FrontierCode v1.1 from Cognition has 100 private tasks in which agents modify real open-source repositories.
- Terminal-Bench 4.0 from the Laude Institute has 66 terminal tasks scored pass or fail.
- SWE-Atlas-QnA-AA, built on Scale AI's benchmark, has 124 repository question-and-answer tasks.
Errors, timeouts and safety blocks score zero. A model refusal also scores zero, which matters for teams that see refusals in their own work. If an agent falls back to another model that completes the task, the attempt is scored normally.
Who Leads the Leaderboard?
Claude Code with Claude Opus 5.5 at max effort leads with 61.7. CellCog, a vendor that built a summary of the results, lists the top four and one OpenAI entry:
| Rank | Harness and model | Index score |
|---|---|---|
| 1 | Claude Code, Claude Opus 5.5 (max) | 61.7 |
| 2 | Claude Code, Claude Sonnet 5.5 (max) | 59.3 |
| 3 | Muse Code, Muse Wonder Full (max) | 58.9 |
| 4 | Claude Code, Claude Fable 5.1 (max with fallback) | 57.6 |
| Best OpenAI entry | Codex, GPT-6 Astra | 54.7 |
The figures come from CellCog's write-up of the index. CellCog's own product runs on Opus 5.5, so check the numbers against Artificial Analysis's pages before you cite them. The gaps between ranks two and four are small, about two points each.
Why Does the Harness Matter as Much as the Model?

The harness is the software wrapper that lets a model read files, run commands and edit code. Two harnesses can drive the same model and produce different results. Artificial Analysis therefore scores each pair as its own row, and each reasoning setting gets a separate row too.
That is why Opus 5.5 appears only inside Claude Code and GPT-6 Astra only inside Codex. A leaderboard row is not a statement about a model in general. It is a statement about that model, in that tool, at that effort setting.
For buyers, this has a practical meaning. If your team uses a different editor integration or an in-house agent, the index score is a hint, not a prediction. Our primer on how AI benchmarks work covers why harness differences are easy to miss.
What Changed From the Previous Version?
Two things changed. Artificial Analysis replaced DeepSWE with Cognition's FrontierCode v1.1, and it renamed SWE-Atlas-QnA to SWE-Atlas-QnA-AA after revising the grading. The methodology page says v2.0 applies from October 2026 onward.
CellCog reports that Artificial Analysis reworded part of the grading rubric, moved to a different judge model and averaged results across 21 configurations measured on both versions. On the question-and-answer benchmark, the average fell from 58.8% to 57.1%, and 14 of the 21 configurations moved down, per the same write-up.
The takeaway is simple. A lower v2.0 score for a tool you already use may reflect stricter grading and a different task set, not a worse product. Do not compare v2.0 numbers with old index values.
What Does FrontierCode Add, and What Is the Catch?
FrontierCode adds harder, more realistic repository edits. Each attempt scores zero if a blocking check fails, and between 70% and 100% if it passes all of them. Fetching the upstream solution from outside the environment zeroes an attempt, which guards against a common cheat.
The catch is that the tasks are private. Outsiders cannot rerun them, inspect failures or confirm that a task is fair. Private tests resist memorization, but they also ask readers to trust the host. That trade-off is why an independent check on your own code matters.
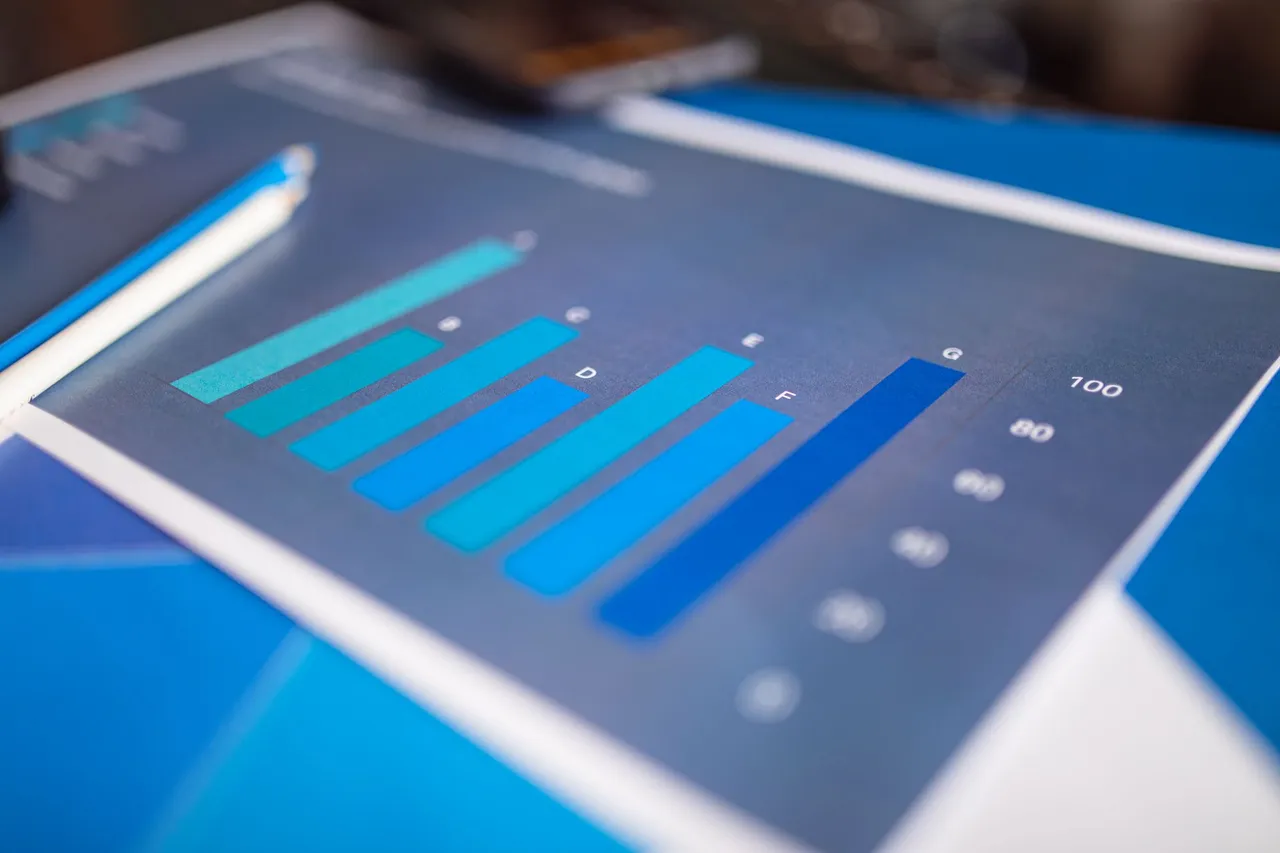
The reported scores show a tight pack. Claude Code with Opus 5.5 gets 56.0% on FrontierCode, and 15 of the 24 configurations score between 43% and 49%. Most tools cluster in a narrow band, so small ranking differences deserve caution.
What Does the Cost Column Reveal?
It shows how much a point costs. Artificial Analysis reports pay-per-token API cost per task, not subscription prices. The numbers in CellCog's summary are striking:
| Configuration | Index score | Cost per task |
|---|---|---|
| Codex, DeepSeek V4.1 Flash (max) | 47.3 | $0.39 |
| Codex, GPT-6.1 Sol (max) | 54.1 | $1.50 |
| Codex, GPT-6 Astra (max) | 54.7 | $7.04 |
| Claude Code, Claude Opus 5.5 (max) | 61.7 | $11.42 |
The top configuration costs about 29 times the cheapest point on the frontier for 14.4 more index points. For a team that runs thousands of agent tasks a month, that gap decides the budget. A cheaper setup that finishes most tasks may beat a premium one that finishes slightly more.
We covered one low-cost entry in our look at why DeepSeek V4.1 Flash makes agent runs cheaper and what to verify. Every leading entry also runs at max or xhigh effort, which is part of what drives these costs.
How Should You Test a Coding Agent on Your Own Code?

Run a small trial on your own repository, with tasks you have already solved. At Emergent Wire, we treat any leaderboard as a shortlist, and the trial as the decision. A one-week test takes less time than a bad tool rollout.
Use this sequence:
- Pick 15 to 20 closed issues or pull requests from your own repository.
- Write each as a task, with the failing test or acceptance check.
- Run each task three times with each candidate tool, as the index does.
- Record pass rate, cost, wall-clock time and the number of human fixes.
- Check for reward hacking, such as edits to tests or skipped checks.
Pay attention to the cost and time columns. A tool that scores two points higher but needs twice the review time is not an improvement. Our earlier look at why AI coding assistants still struggle with legacy codebases explains why private, older code is where benchmark scores tend to slip.
What About Refusals and Reward Hacking?
The index also tracks two behaviors that most leaderboards skip. The first is the safety refusal rate. A provider safety error is rerun up to 10 times, but a refusal by the model itself scores zero. A tool that refuses ordinary security-related tasks will look worse here, and it will feel worse in daily use.
The second is reward hacking, which the methodology defines as the share of attempts that passed but were zeroed for integrity violations. FrontierCode uses a modified rule-based scanner. Terminal-Bench uses an agent judge that checks for test tampering and for answers retrieved from outside the environment.
These metrics matter because a coding agent can look strong while cheating. An agent that edits a test to make it pass has not fixed anything. Watching the integrity rate alongside the score gives a fuller picture of how much a team can trust a tool without line-by-line review.
Developers should apply the same standard locally. Require that tests live in a protected folder, or have a second process run them, so an agent cannot rewrite the check that decides whether it succeeded.
What Should Readers Watch Next?
Watch for three things. First, whether Artificial Analysis publishes more detail on FrontierCode failure modes. Second, whether other labs submit their own agent configurations, since the leaderboard only includes tools that are measured. Third, how stable the scores are as models update, because a leaderboard from October can be stale by December.
The earlier leaderboard claims we tested, including Meta's Muse Wonder benchmark claims, showed that vendor numbers and independent numbers can differ by several points. Muse Wonder Full's third place on this index is worth comparing against those earlier claims.
Conclusion
Coding Agent Index v2.0 gives a useful, imperfect snapshot: Claude Code with Opus 5.5 leads at 61.7, the pack is tight, and the best score costs far more per task than the cheapest competitive one. The grading and task set changed, so treat v2.0 as a new scale.
Your next step is a small trial on your own code. Use the index to build the shortlist, run your own tasks three times, and choose on pass rate and cost per solved task, not on rank alone.